Some Thoughts on John Stossel's Myths, Lies, and Downright Stupidity
Mitch Golden
mgolden@mitchgolden.com
March 10, 2004
v1.0
On Jan 23, 2004, ABC 20/20 aired a special edition hosted by John Stossel. The show, titled Myths, Lies, and Downright Stupidity, featured 10 segments, each of which focused on a belief that Stossel feels is both widely held and wrong. A synopsis of the show is given here.
It is not my intent in this work to argue with or attempt to disprove any of the positions advocated on the show. The goal of this exercise is to take seriously two of the points Stossel raises, and to see what if anything can be concluded from carefully examining them. In all cases I want to give Stossel the benefit of the doubt, and to follow the arguments as actually given on the show wherever I find them leading. In taking this attitude I don't mean to imply that I feel that there are no other discussions one could have on these matters, just that this approach interests me more for the moment.
In this note I'll discuss just two of the segments:
The Rich Don't Pay Their Fair Share - This segment featured an interview with Al Sharpton, in which he wrongly stated that the top 1% of taxpayers pay only 5% of the total federal income tax burden. In fact, as the show reported, the IRS figures show that the figure is more like 35% percent. The segment ends with the now-infamous Howard Dean whoop, warning the viewers not to take too seriously the politicians who are claiming that the rich don't pay enough in federal income tax.
Money Will Make You Happy - A study has shown that once a family reaches a total of $60,000 in income, further increases do not actually improve the happiness of its members. The segment includes an interview with hip-hop promoter Russell Simmons who claims that 13 of the 15 billionaires he knows are miserable.
It is of note that the only statistics mentioned in the "fairness" segment are the percentages of the federal income tax paid by the top 1% and 5% of the population. (Only the federal income tax is discussed.) It would appear that we are to determine the fairness of the system from just these numbers. The top 1%, paying 35% of the federal income tax, are asserted to be "paying their fair share" - would the same be true, for example, if they paid 10%? Or 70%?
The most obvious conclusion that can be taken from this presentation is that Stossel is arguing that each percentage of the population should be paying the same fraction of the total income tax. This implies that every family pays the same amount - not merely as a fraction of its income, but in absolute dollar terms. This position is so extreme that I have not heard anyone seriously advocate it - and I don't think that this is what Stossel really means to be saying. Instead I take it that the segment has left out some of the statistics that would allow us to determine something significant (beyond Al Sharpton's lack of expertise about the income tax). How we are to know what is "fair" is seemingly left as a mystery.
We could now call into this discussion other statistics that we could use to inform the debate, such as income represented by each percentile of the income ranking, and use them to construct some discussion of "fairness". This would, however, be out of line with the approach given in the introduction.
Instead, let's consider what follows from the assertion that money doesn't buy happiness.
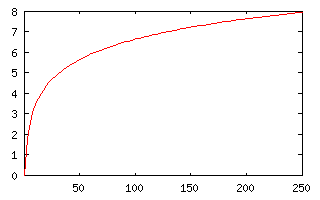
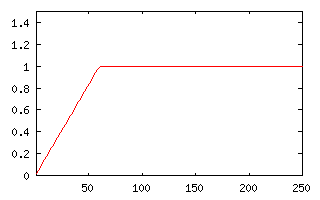
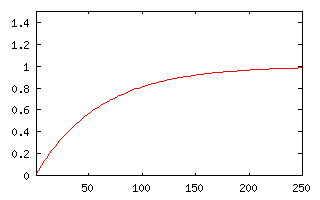
The statement that no additional utility (the economists' word for "happiness") is derived from incomes above $60,000 is actually a rather radical proposition. It implies that there is a fixed level beyond which all desires to increase income are irrational. This claim is much stronger than, for example, the assertion of a law of diminishing returns.

|
| Fig 1: A logarithmic utility function. The y axis is in arbitrary units, the x axis in thousands of dollars. |
|
| Fig 2: A utility function that saturates. This function turns off abruptly at $60,000. |
|
| Fig 2: A utility function that saturates smoothly at about $60,000. |
Of course none of this directly bears on the "fairness" of the income tax, but it seems a rather small jump to assess what Stossel might think about various possible tax codes. Working with the utilities instead of the dollars allows us to at least assess what effect it has to take money from people. As we will see, there is still a great deal of esthetics and value judgment involved, but this is at least a start.
Let's begin by playing the game as an economist might. We'll model families as having a single variable, its income. The income is the unique determiner of each family's happiness (utility). The government is going to try to collect some fixed revenue - of an amount decided externally - by taxing the families' income.
(An aside here is that there is a difference between income and wealth. This distinction is not spelled out in the segment, but we might prefer to at least acknowledge that it really should make the picture more complex. In principle, the billionaires in the piece might be unhappy because, while they have huge wealth, they are actually currently not making money. More likely, really, is the reverse statement - a billionaire with an income of $10,000 is likely to have a greater utility than someone earning minimum wage.)
We can immediately see why taking the same amount of money from each family is virtually universally considered unfair. If it did this, no matter which of the cases above holds, the government would be taking much more utility from those at the bottom end of the income spectrum than those at the top.
Let's suppose that the utility function is logarithmic, as shown in figure 1. The government might decide to take the same amount of utility from each family. So, for example, it might take 1 unit of utility from everyone. The families at 200k income move to 100k, the families at 100k move to 50k, etc. This results in a flat tax of 50% of income. Presumably 50% is more than the government needs, so the rate would be different. However, so long as the government wants to take the same amount of utility from every family, it will take the same percentage of its income.
Of course, even if the utility is logarithmic, one might consider that taking the same utility from each family no matter what its level of utility is doesn't sound too fair. So, for example, it might choose to take the same fraction of the family's utility. Should the government pursue a policy of this sort, it will institute a progressive tax, with a marginal rate that rises logarithmically with income.
I think that it's safe to assume that Stossel's libertarian views would make him prefer the first scenario to the second, but this is only a guess on my part. It's hard to imagine a rational view that holds that the tax rate should decline with income so long as the utility function is logarithmic.
Once we enter the realm of the "money can't buy happiness" functions, the situation is clearer - the tax rate has to be progressive. It's easiest to see this in the case depicted in figure 2, in which the rise utility above $60,000 is exactly 0. In this case, the government can't collect anything from the families below $60,000 in income until all of the income above $60,000 has been taken in taxes. This is because their income above this amount actually has no utility to the families earning it. Amusingly, in this somewhat pathological example, it doesn't matter how the government takes the money from these people - all equally, or all from one family. If the families above $60,000 fail to yield enough revenue, then the government has to make the sort of esthetic decision described in the previous example. If it wants to take the same utility from each family, then every family contributes the same dollar amount, after bringing its income to $60,000.
In the more realistic case of figure 3, we need to know the details of the function to determine what is "fair". However, there are some features that will always hold, no matter what the shape of the utility curve is. We can definitely say this: The largest part of the tax burden will be born by those who are deriving little utility from the income they earn - those families with income over $60,000. Roughly speaking, the flatter the utility function is at the given level of income, the higher marginal tax rate the family will pay. In fact, if the government decides to take any given, fixed amount of utility from everyone, there's a maximum amount of income any family can have. Unlike case 2, a certain minimal "fairness" rule will have to be observed whether the government decides to take a fixed utility or a fixed percentage of its utility, namely, if family A has a higher utility than family B before they pay taxes, it will still have a higher utility after the tax is collected. It is always worth something to earn money, though not very much.
Possibly the most striking feature of the worldview that "money can't buy happiness" is that there can't be a top tax bracket of less than 100% - we've already seen that a flat tax corresponds to a logarithmic growth in utility, and so the tax rate can never become flat for any "money can't buy happiness" utility curve.
The US tax code was constructed as the result of a political process. It's not even really arguable that the US tax code is even intended as a systematic attempt to be fair in the sense discussed here. Money earned in different ways is treated rather differently, capital gains vs. ordinary income for example, though it's hard to imagine that the different forms of income have different utilities to their recipients. An argument can be made that by being "unfair" in some way the tax code serves some other purpose, such as stimulating the economy, but that's would take us to a much larger discussion.
Still, the question remains: Should the show have claimed that the rich pay their fare share, given the assertion that money doesn't buy happiness? What does the US tax code actually look like?
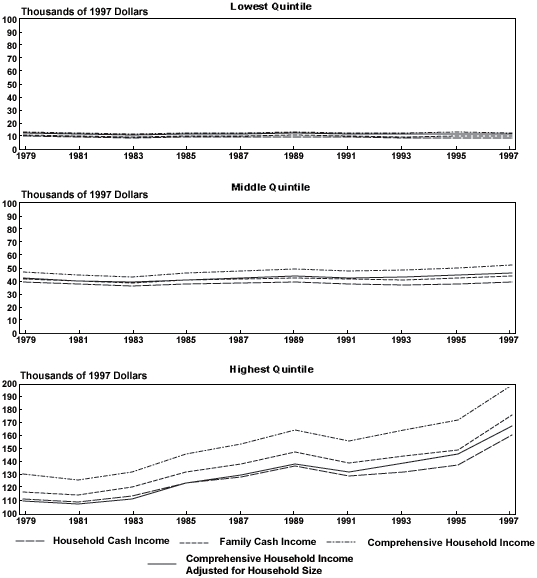 Here are the relevant statistics. The data here are rather old, from the Congressional Budget Office's document, Effective Federal Tax Rates, 1979-1997. Still, the discussion is informative, even though it does not actually include the effects of the tax cuts of 2001.
The first graph to examine is figure 3-9 of that document, shown at right. It is entitled Average Real Pretax Income by Income Measure and Quintile. This shows that the top 1/5 of households earned an income in 1997 of approximately $160,000 1997 dollars (adjusted for household size), while the bottom 1/5 of taxpayers earned only approximately $10,000 1997 dollars. It is clear from this chart that the income of the top earners has been increasing substantially over the two decades covered in the document, while the middle and lower quintiles have made little if any progress. Note that if we want to avoid taxing the families with below $60,000 in income, we will tax only very lightly the bottom 60% of taxpayers.
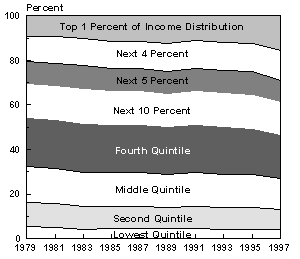
Figure 1-6, below, is Shares of Pretax Household Income, by Income Group. It shows that the top quintile has about half of all the income in the country, a percentage that has been increasing significantly over the time covered - largely because of the increase in the income of the top 1% of taxpayers. Note that the bottom 60% of taxpayers had, in 1997, less than 30% of total income.
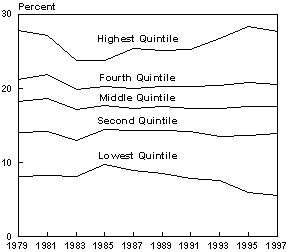
The total federal tax rate confronted by these various taxpayers is progressive, but those even with very low incomes face substantial tax rates, as shown in Figure 1-2, Total Effective Federal Tax Rates, by Income Quintile:
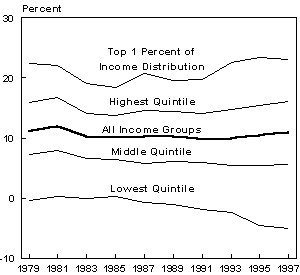
However, the segment discussed only the federal income tax (leaving out, notably, payroll taxes, such as the ones that support Social Security and Medicare, which are a substantial share of the overall tax burden, and are regressive). The income tax, considered alone, is more progressive, and in fact has a negative rate for the lowest quintile of taxpayers, as shown in Figure 1-8, Effective Individual Income Tax Rates, by Income Group.
As I stated at the beginning, it is somewhat a matter of personal preference what to make of this data. However, it's tough to make the case that the authors of the tax code believed that even very large quantities of money will fail to buy happiness.